In high-reliability manufacturing, the unexpected failure of a glass or ceramic component can lead to severe consequences, making precision glass defect analysis and ceramic defect analysis essential for laboratory professionals. These critical material flaws often originate from invisible, micro-scale anomalies, such as challenging sub-micron inclusions, thermal gradients, or complex bubble analysis issues that manifest as internal stress patterns. Identifying these issues requires moving beyond simple visual inspection to employ advanced microanalysis, as a single defective sample is a treasure trove of physical and chemical evidence that, when properly examined, unlocks the definitive root cause analysis necessary to prevent recurrence.
This article explores the core analytical methodologies labs use to perform precision glass defect analysis and ceramic defect analysis, turning seemingly insignificant material failures into data points for critical process optimization.
Analyzing Material Flaws: Stress Patterns and Fractography
The first step in any comprehensive material failure investigation is morphological analysis. Understanding the physical characteristics of the defect—its shape, size, location, and the associated stress patterns—is paramount before undertaking chemical characterization. These physical features are often the direct evidence of a mechanical, thermal, or kinetic failure mode.
The laboratory must deploy techniques that allow for non-destructive observation and precise measurement of the defect structure. This initial phase helps categorize the flaw, whether it is a fracture, a lamination, an inclusion, or a structural inhomogeneity.
Key Morphological Analysis Techniques:
| Technique | Principle | Primary Insight Provided |
|---|---|---|
| Stereomicroscopy | Low-magnification, high-depth-of-field visual inspection. | Initial sizing, location, and categorization of large defects, fractures, or cracks. |
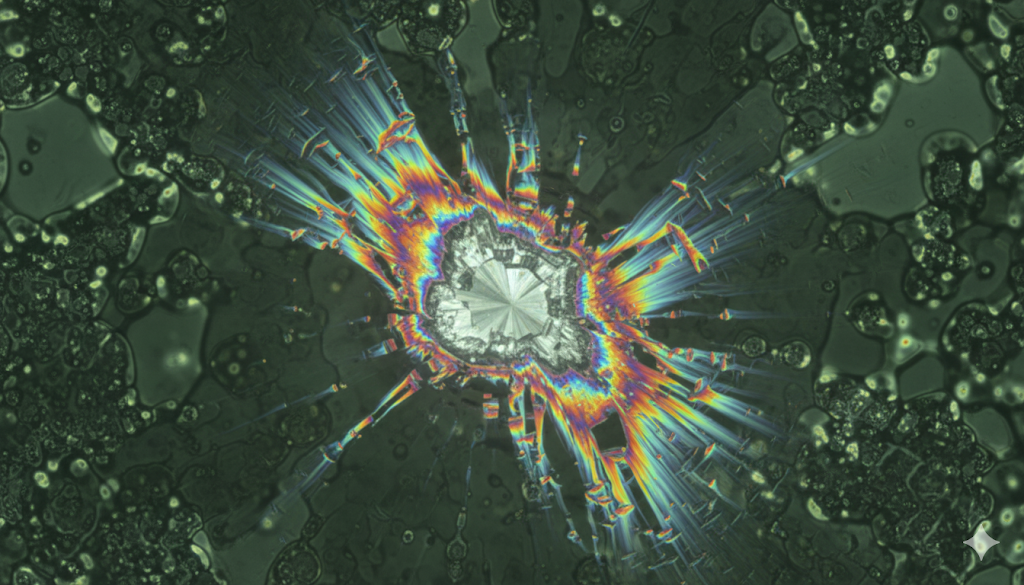
| Polarized Light Microscopy (PLM) | Uses polarized light to reveal optical anisotropy. | Identifies crystalline inclusions in glass, analyzes internal stress patterns, and detects residual strain caused by uneven cooling. |
| Scanning Electron Microscopy (SEM) | Uses an electron beam to generate high-resolution surface images. | Detailed morphological characterization of fracture surfaces (fractography), porosity, and micro-cracks at high magnification. |
| Atomic Force Microscopy (AFM) | Measures surface topography by scanning with a fine probe. | Ultra-high resolution 3D topography of surface roughness, pits, or nanoscale imperfections. |
Analyzing material flaws often involves fractography, the detailed study of fracture surfaces. By tracing the fracture origin back to a characteristic pattern—such as a “Hackle” or “Mirror” zone in glass—the analyst can determine the direction and speed of the crack propagation, leading directly to the location of the critical initiating defect.
Chemical Contamination and Root Cause Analysis Using Spectroscopy
While physical inspection defines what the defect looks like, chemical analysis answers the crucial question of why it occurred. Most material flaws and structural weaknesses in glass and ceramics are initiated by foreign chemical contaminants or compositional deviations. These inclusions act as stress concentrators and sites for crack initiation. Effective root cause analysis relies on identifying the exact chemical fingerprint of the impurity.
This is where spectroscopic and elemental analysis techniques, often coupled with SEM, become indispensable. Energy Dispersive X-ray Spectroscopy (EDS or EDX), typically mounted on an SEM, is the workhorse of inclusion analysis. By bombarding the sample with electrons, EDS detects the characteristic X-rays emitted by the atoms in the material, providing an elemental composition map of the defect site. This allows the lab to distinguish between, for example, a refractory inclusion (from furnace lining), a refractory-based contaminant (like mullite or zircon), or a foreign material like iron or chrome (often from processing machinery).
Analytical Chemistry Tools for Defects:
- SEM-EDS/EDX: Elemental identification and mapping of solid inclusions (e.g., distinguishing between silica stone, refractory material, or devitrification).
- Wavelength Dispersive X-ray Spectroscopy (WDS): Offers superior spectral resolution compared to EDS, making it ideal for accurate quantification and detecting light elements or minor constituents that are critical in pinpointing the source of contamination.
- Fourier-Transform Infrared Spectroscopy (FT-IR): Identifies organic contaminants or certain mineral phases by analyzing molecular vibrations. This is essential for tracing non-elemental sources like lubricants, processing aids, or residue.
- Raman Spectroscopy: Excellent for phase identification, especially in crystalline ceramic inclusions, providing chemical bonding information where elemental data is insufficient.
By triangulating the physical location (morphology) with the precise chemical composition (spectroscopy), the laboratory can trace the impurity back to a specific upstream process variable, whether it’s a raw material batch, a compromised piece of equipment, or atmospheric contamination. This targeted approach is the essence of high-value root cause analysis.
Precision Glass Defect Analysis: Bubble Analysis and Inhomogeneities
Glass defect analysis presents unique challenges, often centering on gaseous inclusions (bubbles or seeds) and compositional inhomogeneities (striae). These defects are intrinsically linked to the glass melting and forming process and directly impact optical clarity, thermal stability, and mechanical strength.
Comprehensive Bubble Analysis
Bubbles—or gaseous inclusions—are perhaps the most common and critical defect in glass. While visually obvious, understanding their genesis requires analyzing the gas contained within them. Bubble analysis is a highly specialized microanalytical technique that uses tools like Gas Chromatography/Mass Spectrometry (GC/MS) or micro-Raman spectroscopy.
The key to preventing bubbles is knowing their composition:
- Oxygen (O2) or Carbon Dioxide (CO2): Often indicates residual gas from the batch materials (e.g., decomposition of carbonates) or inadequate fining (removal of gas from the melt).
- Nitrogen (N2) or Argon (Ar): Can suggest air entrapment during forming or melting processes, particularly if found alongside oxygen.
- Sulfur Dioxide (SO2): Points to interactions between the glass melt and the furnace atmosphere or the use of sulfate fining agents.
Labs employ techniques such as laser perforation, where a microscopic laser is used to pierce the bubble wall, releasing the gas into a measurement system for composition analysis. This targeted bubble analysis provides immediate feedback on the efficacy of fining agents or the integrity of the melt atmosphere.
Analyzing Striae and Inhomogeneity
Striae are refractive, compositional lines in the glass that indicate incomplete mixing or volatilization issues. These inhomogeneities create localized areas of different viscosity and thermal expansion, which manifest as stress patterns that can lead to failure upon thermal shock or mechanical loading. Density measurements and PLM are typically used to characterize striae, while microprobe analysis is employed to determine the precise compositional difference between the striated and bulk glass.
Advanced Ceramic Defect Analysis: Microstructure and Porosity
Ceramic defect analysis, particularly for advanced engineering ceramics (such as alumina, zirconia, silicon carbide, and nitrides), focuses heavily on microstructural features that compromise fracture toughness and strength. Defects often arise from density variations, grain boundary issues, and residual porosity from sintering.
Microstructural Characterization and Porosity
Ceramics are polycrystalline materials whose strength is dictated by grain size and boundary integrity. Defects often manifest as:
- Macro-pores and Micro-pores: Residual porosity from incomplete sintering. Porosity acts as a stress concentrator. Techniques like X-ray micro-Computed Tomography (μCT) allow for non-destructive 3D visualization and quantification of internal porosity, which is critical for ceramic defect analysis.
- Abnormal Grain Growth: Localized contamination can accelerate grain growth, leading to brittle fracture paths. High-resolution Transmission Electron Microscopy (TEM) is used to analyze grain boundaries and sub-nanometer-scale phase separations.
- Phase Transitions and Stability: Ceramics are sensitive to phase changes during processing. X-ray Diffraction (XRD) is vital for phase identification, confirming that the desired crystalline structure (e.g., tetragonal vs. monoclinic zirconia) was achieved and remains stable.
Identifying these material flaws in ceramics is often a multi-modal process. For instance, a brittle failure might be traced via SEM fractography to an area of unusually high micro-porosity identified by μCT, with the root cause analysis then confirming a localized concentration of sintering aid using EDS.
Translating Defect Analysis into Strategic Process Improvement
The true value of microanalytical glass defect analysis and ceramic defect analysis is not just identifying the flaw, but translating that finding into an actionable process change. For example, finding a high concentration of Al2O3 and SiO2 in a glass inclusion (a “stone”) points directly to erosion of the aluminosilicate refractory lining, requiring a material change or process adjustment. Finding elemental contamination like Fe or Ni in a ceramic suggests wear on the grinding or milling equipment.
By outsourcing these highly technical microanalytical tests, manufacturing and quality control labs can gain access to a full suite of state-of-the-art instruments and specialized expertise, rapidly identifying and resolving complex material issues without the prohibitive capital investment. This data-driven approach to quality control ensures that manufacturing material flaws are not only identified but permanently engineered out of the process, improving product reliability and securing the supply chain.
The Final Step: Securing Production with Expert Glass and Ceramic Defect Analysis
The integrity of your final product hinges on the ability to microscopically examine failures and derive meaningful, actionable conclusions. Whether struggling with persistent bubble analysis challenges in optical glass, or tracing complex stress patterns in advanced ceramics, expert laboratory analysis provides the definitive answers required for quality assurance. The application of precise analytical chemistry and physics transforms a single failure into a blueprint for future success.
Submit a testing request today to partner with specialized microanalysis laboratories capable of executing detailed glass defect analysis and ceramic defect analysis to identify material flaws and complete a definitive root cause analysis.
FAQ
The timeline for root cause analysis depends on the complexity of the defect, but initial screening and analysis using techniques like SEM-EDS can often be completed within 1-3 business days. More involved gas and bubble analysis may require longer sample preparation and run times.
While both use microanalysis, glass defect analysis often focuses on amorphous issues like striae, compositional changes, and gaseous inclusions (like bubble analysis). Ceramic defect analysis focuses on crystalline microstructure, porosity, grain boundary integrity, and phase stability, directly impacting mechanical strength.
Polarized Light Microscopy (PLM) is the most effective and common method for visualizing stress patterns and residual strain in glass. It reveals anisotropic areas caused by internal stress, guiding the analysis to potential failure initiation sites.
Yes. A thorough root cause analysis uses the chemical signature of the inclusion (e.g., from WDS or EDS) and compares it against known process materials (refractory, raw materials, grinding media). This triangulation allows experts to definitively trace the material flaws back to a specific point in the supply chain or production process.
This article was created with the assistance of Generative AI and has undergone editorial review before publishing.